Every watt of race day,
planned before the start.
A power pacing tool for the bike leg of a triathlon: enter the course, your FTP (functional threshold power) and weight to get segment-by-segment target power, wind conditions and a finish time prediction. Export it to your head unit and ride the plan.
Plan my race power for free Backtested on 60 real ride files · median error about 2% · 90% of races within ±5% A free account is enough to build a plan · invite-only beta (ask your coach for an invite code)
Actual screen, IRONMAN WORLD CHAMPIONSHIP · KONA, six-level plan at FTP 250W (5:50:49, same calculation as the demo above)
the full IRONMAN series plus Challenge
backtested on 60 real ride files
with wind direction factored in
head unit course file · race card · Zwift
PACESCIENCE ENGINE
Same FTP, different watts on every course.
Segment gradient, heading, humid air density, wind projection: every number has a source. On a flat course it will tell you straight that one steady power is fastest. On a hilly course it tells you which segment is worth ten extra watts.
Wind is a hill too
A headwind is like a climb: press. A tailwind is like a descent: ease off. The engine works each segment's wind direction and strength into its level, so the headwind stretch on Kona's Queen K gets bumped up a level automatically. Experienced riders already ride this way. Now it is written into your plan.
Race-day weather, fetched automatically
Within 15 days of the race it uses the hourly forecast; further out, it uses measured weather from the same dates over the past five years. Pick the date and start time, and temperature, humidity and wind direction go straight into the calculation.
Every course comes with intel and advice
All 208 courses come with written course intel, and the engine adds one piece of advice you can use on race day, based on terrain, wind, heat and elevation. Your own uploaded GPX gets the same.
No plan to memorize.
Just ride it.
For each segment of the course, the plan gives you one level, as intuitive as shifting gears: Steady on the flats, Press on gentle climbs, stand up and Stomp over short steep pitches, and on long climbs too hard to sustain it drops back to a level you can hold. The watts for each level come from your FTP and that course, and not just from gradient: wind direction and strength are worked in segment by segment, so the same climb can be a different level into a headwind than with a tailwind. On race day your head unit pops up a cue at the start of each segment, or you stick the race card on your top tube and see at a glance which level this segment takes.
Penghu looks flat: 179 km with only 1,100 m of climbing. But once the April monsoon is worked in segment by segment, of the 68 segments 16 need Dig and 16 can go Light; riding this plan saves 1 min 27 s over constant power (demo values: FTP 250W · 68 kg).
Export it as a head unit course file and your head unit follows the map; at the start of each segment it shows that segment's level and power. Nothing to memorize, and no looking down for the race card.
Predictions built from your own races.
Everyone's aero drag is different, and a lookup table can only give you a range. Upload a past race FIT file with power and the engine uses physics to solve for your CdA on that day. Every plan and finish prediction after that is built on your own number.
After the race, upload that day's file and compare. Every race you add brings the prediction closer to you.
Course rankings
Speed score (0–100) = how easy it is to ride a fast time on this course on race day: climbing density, speed loss from turns, plus the historical temperature and wind for that event's slot on the calendar (measured over the past five years, same dates). Once you pick an exact date, the system switches to that day's forecast.
Fastest courses
Hardest courses
— courses in this group · scores include historical race-day weather · click any course to start a plan · See the full rankings (filter by region and month) →
CdA Lab: aero analysis without a wind tunnel.
An athlete with an 8:17 full-distance finish measured a CdA of 0.212 in the HKUST wind tunnel. AeroPacer got 0.214 from his race file, a 0.8% difference. All you need is the power file you already have.
Converging history
Every upload accumulates automatically. Multiple records are weighted and converged into a CdA with a confidence band, so it gets more accurate with every test, and gains from position and equipment show up on the trend chart.
Equipment comparison
Tag records with a setup label (new helmet A / old helmet) and they are merged and compared automatically, with the difference converted straight into seconds over 90K. My routes lets you simulate it on your own time trial course too.
Deep analysis
A plain-language summary card tells you whether this record can be trusted and where things went wrong (flat tire, drafting, position slipping). Virtual elevation and rolling CdA charts are there for advanced reading.
Three steps to a plan you can take onto the course.
Pick a course
Search and pick from 208 real courses, or upload your own GPX.
Enter your numbers
FTP, weight and position, or work out your CdA from a race FIT file.
Take it to the race
See power segment by segment, then export to your head unit or print a race card in one click.
The numbers are half the job. Riding them on race day is all of it.
Head unit course file
Import into Garmin or Wahoo and go: course map, elevation profile, and a power cue that pops up at the start of every segment.
Race card
One A4 sheet: distance, level, power range. Print it and stick it on your top tube. Under race pressure it beats a screen.
Pre-race rehearsal
Turn your race plan into a Zwift workout and ride it indoors before race day.
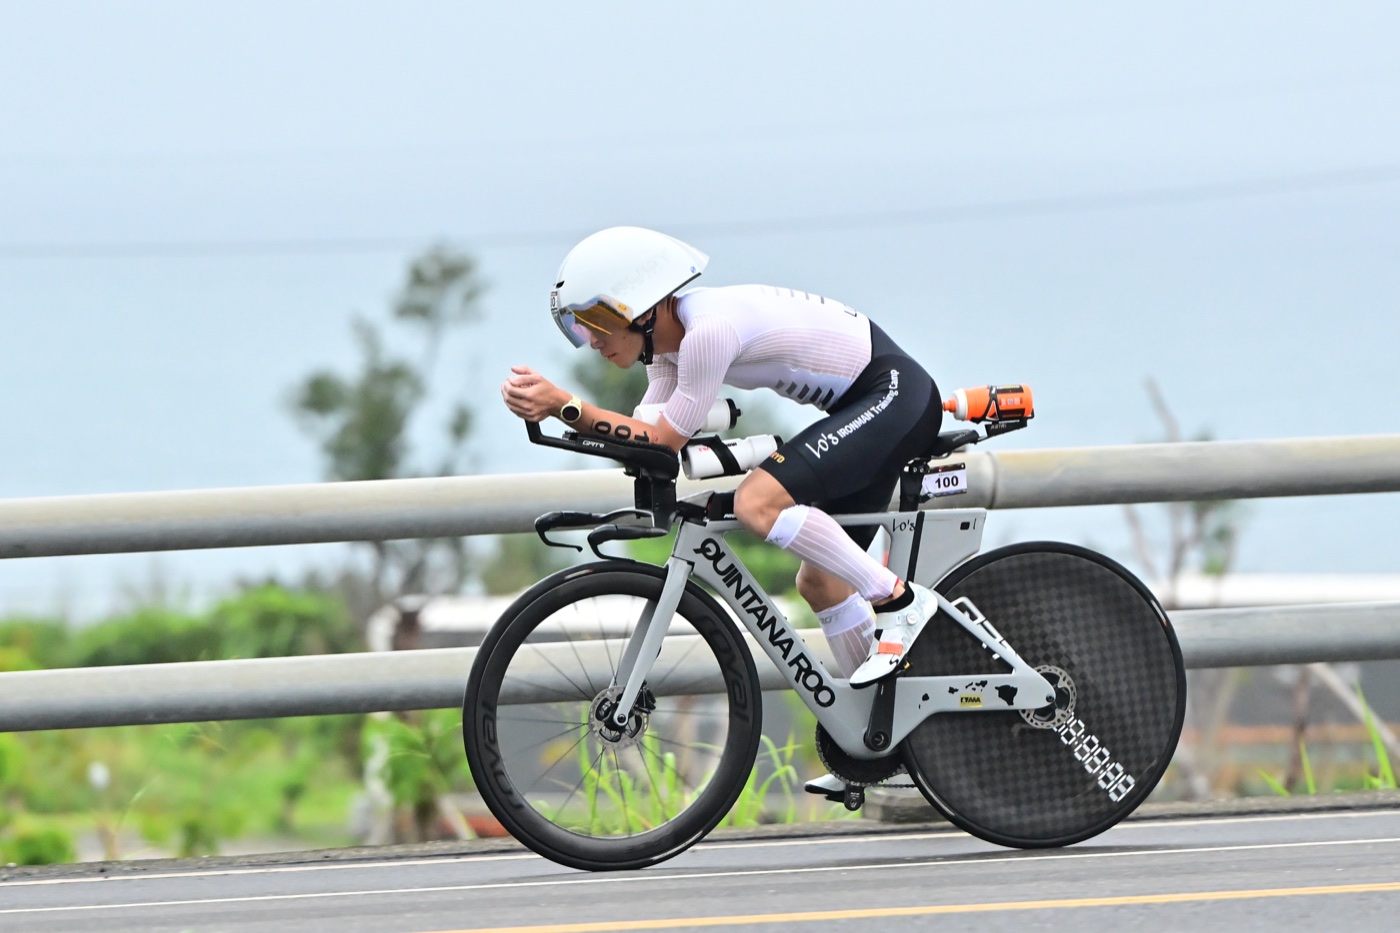
The person who built this tool rides it too.
Lo U IanTriathlon coach · Founder of AeroPacer
Born and raised in Macau, moved to Taiwan for university and has lived there since. Coaching since 2016, with more than 100 athletes coached one on one; over 20 of them have qualified for the IRONMAN World Championship and 3 have gone under 9 hours at full distance. Co-founder of the running analytics service RunningQuotient, and author of three Chinese-language books: Self-Coached Triathlon Training, The Complete Guide to Scientific Marathon Training, and Understanding Cycling Power Training Data.
Ten years of taking athletes to races, and the bike power in every race plan was worked out by hand: study the course, guess the wind, estimate CdA. AeroPacer turns that method into an engine, then checks it race by race against my athletes' files and my own. My own results: 2nd overall at Challenge Taiwan 226 in 2026 in 9:15:17, and a finish at the Kona World Championship in 2022.
- IRONMAN Certified Coach
- Among the first in Asia-Pacific to earn STRYD Run with Power Level 2 certification
- Athletes across Taiwan, Hong Kong, Macau and China