Articles /
A Wind Tunnel and a Race File, 0.8% Apart
A CdA number is cheap to publish and expensive to check. Every aero product on the market quotes one. Almost none of them tell you what it was measured against.
So here is mine, checked against the only instrument that settles the argument.
In January 2026, Pengcheng Li, an athlete with a full distance finish of 8 h 17 min, took his race equipment into the wind tunnel at the Hong Kong University of Science and Technology. Six months later he raced IRONMAN Hamburg. I took the power file from that race, fed it to AeroPacer, and let the engine solve for his drag area without ever seeing the tunnel result.
| Method | CdA | Conditions |
|---|---|---|
| HKUST AAF wind tunnel | 0.2123 m² | 0° yaw, 45 km/h, force balance, two repeat runs |
| AeroPacer, from the race file | 0.214 m² | 180 km of IRONMAN Hamburg, 4.3 hours |
| Difference | +0.0017 m², +0.8% | about 2 W at 45 km/h |
Two watts. That is the headline, and the rest of this article is the reason you should not take the headline at face value.
The equipment match is the whole ballgame
A wind tunnel does not measure an athlete. It measures an athlete in a specific setup, and swapping one item changes the answer. So the comparison is only honest if the tunnel configuration is the one he actually raced in.
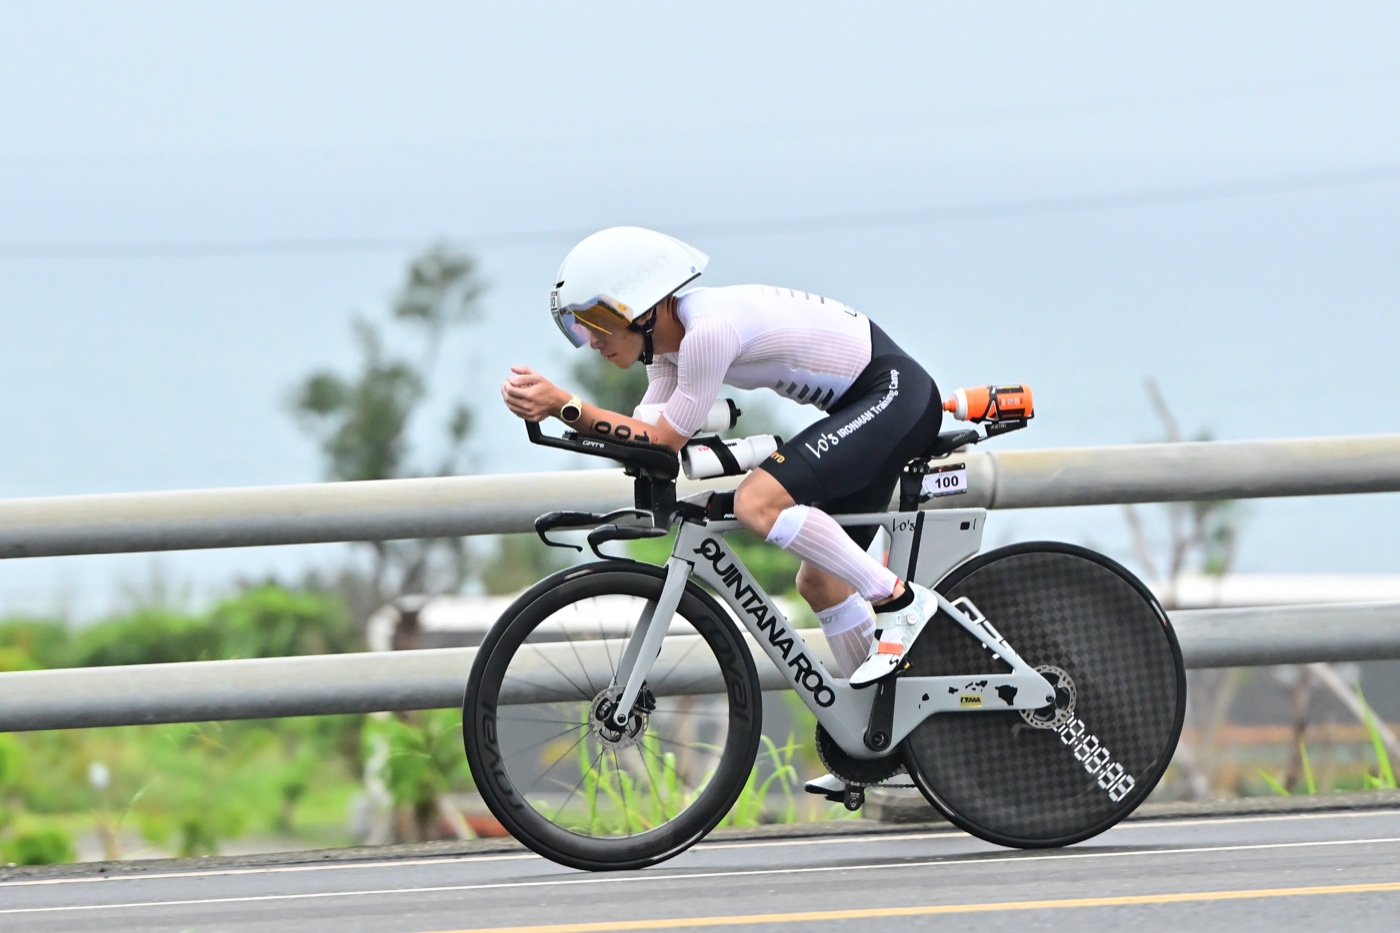
On tunnel day he ran several configurations. The one that matches race day is the Trek frame, the Van Rysel helmet, a 108 front wheel with a disc rear, ribbed leg sleeves, the new skinsuit, and, importantly, a standard race number. That pairing was fixed by what he wore in Hamburg, not by which number came out closest.
This matters because one of the other configurations was identical except for an aero race number, and it measured 0.2105. Against that one, the race file is 1.7% off instead of 0.8%. I could have quoted either. Picking by race-day equipment is the only defensible rule, and it happens to cost me nothing here, but you should know both numbers exist.
What the tunnel measured
Single point: 0° yaw, 45 km/h, force balance, fixed position. Run twice, and both runs returned 0.2123. That repeatability is what makes the tunnel the reference in the first place.
It is also, as we will get to, exactly why it cannot be the whole truth.
What the race file measured
The engine solves the same power equation everyone uses, run backwards. Forwards, you know a rider's drag and work out the power to hold a speed. Backwards, you know the power and the speed and solve for the drag. The equation is not the hard part. The hard part is that on a real road, four things corrupt it:
- Wind. What matters is the air the rider meets, not the ground speed. Station wind is measured at 10 m and has to be brought down to riding height.
- Gradient. A one percent error in slope swamps the aero term at endurance speeds.
- Position. An athlete four hours into a race does not hold the shape they held in the tunnel.
- Drafting and braking. Both silently inject power the equation cannot see.
Here is what the engine does about them.
It cuts the ride into short fixed-length windows and keeps only the ones where the file is behaving: speed steady, power valid, rider actually moving. Windows with a heading change through them are dropped, because a corner means both a changed position and a brake. Windows above a yaw threshold are dropped, because CdA is a function of yaw and only low-yaw samples belong in one pool. Where the rider's speed changed across a window, the kinetic energy difference is put back into the force balance instead of being left to contaminate the drag term.
That left 1058 usable windows from the Hamburg file.
Out-and-back pairing
Then the part that does the real work. Hamburg's bike course sends you along the same roads in both directions, so most windows have a mirror: same stretch of tarmac, opposite heading. Pair those two and average them, and the two largest error sources cancel each other. A gradient read slightly too steep in one direction is read slightly too shallow in the other. A tailwind that flatters the drag estimate one way punishes it the other. Neither has to be measured perfectly, because the pairing does not care about the absolute value, only that the error flips sign.
The 1058 windows condensed into 283 out-and-back pairs. Those pairs, not the raw windows, are what the reported estimate is built from.
The energy closure cross-check
A second, completely separate method. Where the route closes a loop back to its starting point, every metre climbed is also a metre descended, so gravity nets to zero over the whole loop. What the athlete put in as pedal work has to come out as air drag and rolling resistance, and you can solve the whole-loop energy budget for CdA in one step, using none of the windowing logic above.
That method returned 0.234, about 9% higher than the paired estimate. That is the expected direction: every brake application in four hours dumps energy the budget attributes to air. I report it as a cross-check on the sign and the order of magnitude, not as a rival estimate, and I would be worried if it had come back lower.
The spread
The paired estimate is a median, and the honest way to read it is with its spread: the middle half of the pairs lands between 0.200 and 0.233.
One detail specific to this file. The engine solves every file twice, once with the day's measured wind and once assuming none, and keeps whichever comes out tighter. For Hamburg it kept the no-wind solve, because adding the measured wind made the spread worse. On an out-and-back course that is the expected outcome, since the pairing has already cancelled most of the wind.
They were never supposed to be equal
This is the part that most aero marketing skips, and it is the part that decides whether the 0.8% means anything.
The tunnel measured one position, at one yaw angle, at one speed, on a rig, for the length of a run. The race file covers 4.3 hours in which he changed position hundreds of times, met yaw angles across the whole range the day handed him, rode over real tarmac, and got tired. These are not two attempts at the same measurement. They are two different quantities that happen to be closely related.
If they had come out exactly equal, the right reaction would be suspicion, not celebration. A rider who holds his tunnel position perfectly for four hours does not exist.
So what does 0.8% actually buy? It says the race-file method is not carrying a systematic error big enough to matter, and that his average racing position is close to the position he took into the tunnel. That is a real result and a useful one. It is not "AeroPacer is accurate to 0.8%", and I will not print that sentence.
What would have to be true for this to be luck
Four things could have produced a number this close by accident, and you should hold all of them against the result.
One athlete is one athlete. This is n = 1. It is a check, not a validation study. The validation study is the 60-race backtest, which is where the accuracy claims on this site actually come from.
The point estimate is finer than its own spread. The middle half of the pairs spans 0.200 to 0.233, about 15% of the median. A point estimate landing within 0.8% of the tunnel is partly luck, and the claim the data genuinely supports is the weaker and more useful one: the tunnel value sits comfortably inside the estimate's spread, near the middle.
Rolling resistance and mass are assumptions, and they trade against drag. The solve used 80 kg all in and Crr 0.0040. At his racing speed, a Crr error of 0.0005, which is an ordinary amount of uncertainty about a tyre on an unknown surface, moves the CdA estimate by about 0.005, three times the gap being celebrated. A 2 kg error in system mass moves it by about 0.001. The agreement is finer than the assumptions underneath it, and anyone quoting a sub-1% aero result without saying what they assumed about rolling resistance is not telling you enough.
Hamburg is a friendly file. Flat, out and back, a long steady effort. That is close to the best case for this method. A hilly course, a draft-legal race, or a rider who spent the day sitting up would all give a worse estimate, and the engine flags those files rather than pretending otherwise.
One more independent look
His Kona 2024 race, run through an earlier and cruder whole-race energy method, came out at 0.205. Different course, different year, different maths, 3.4% below the tunnel.
Three independent routes to the same athlete's drag area, from three different continents' worth of road and one laboratory, all landing between 0.205 and 0.214. None of them agrees exactly with the others. All of them agree about what kind of rider he is.
What this means if you are not Pengcheng Li
The useful claim is narrow, so here it is stated as narrowly as I can manage.
Solving CdA from a decent race file gets you close enough to a tunnel measurement that the difference is smaller than the things you are already unsure about, like your tyres and your true system weight. For choosing a pacing target, that is enough. For deciding whether one helmet is 3 W better than another, it is not, and no single race file will ever be, whatever anyone sells you.
A wind tunnel costs money and a scheduling slot. The power file costs nothing, because you already have it.
Notes on trustworthiness
- Every number here comes from the tunnel report and the engine's stored estimate for that file. Nothing is rounded in my favour: 0.8% is 0.0017 on 0.2123, and 0.0017 is about 2 W at 45 km/h in the tunnel's air.
- The tunnel configuration was matched to race-day equipment before the comparison was run, and the alternative configuration's result is published above.
- The race file was never used to tune anything. The engine version that produced 0.214 is the one the site runs.
- The exact window length and the heading and yaw rejection thresholds are part of the engine and are not published. Every number that changes the result is: 1058 windows, 283 pairs, 80 kg, Crr 0.0040, median 0.214, middle half 0.200 to 0.233, energy closure 0.234.
- Pengcheng Li is named here with his permission. His race file is not published.