Articles /
What is a good CdA? The real spread across 8 triathletes and 71 ride files
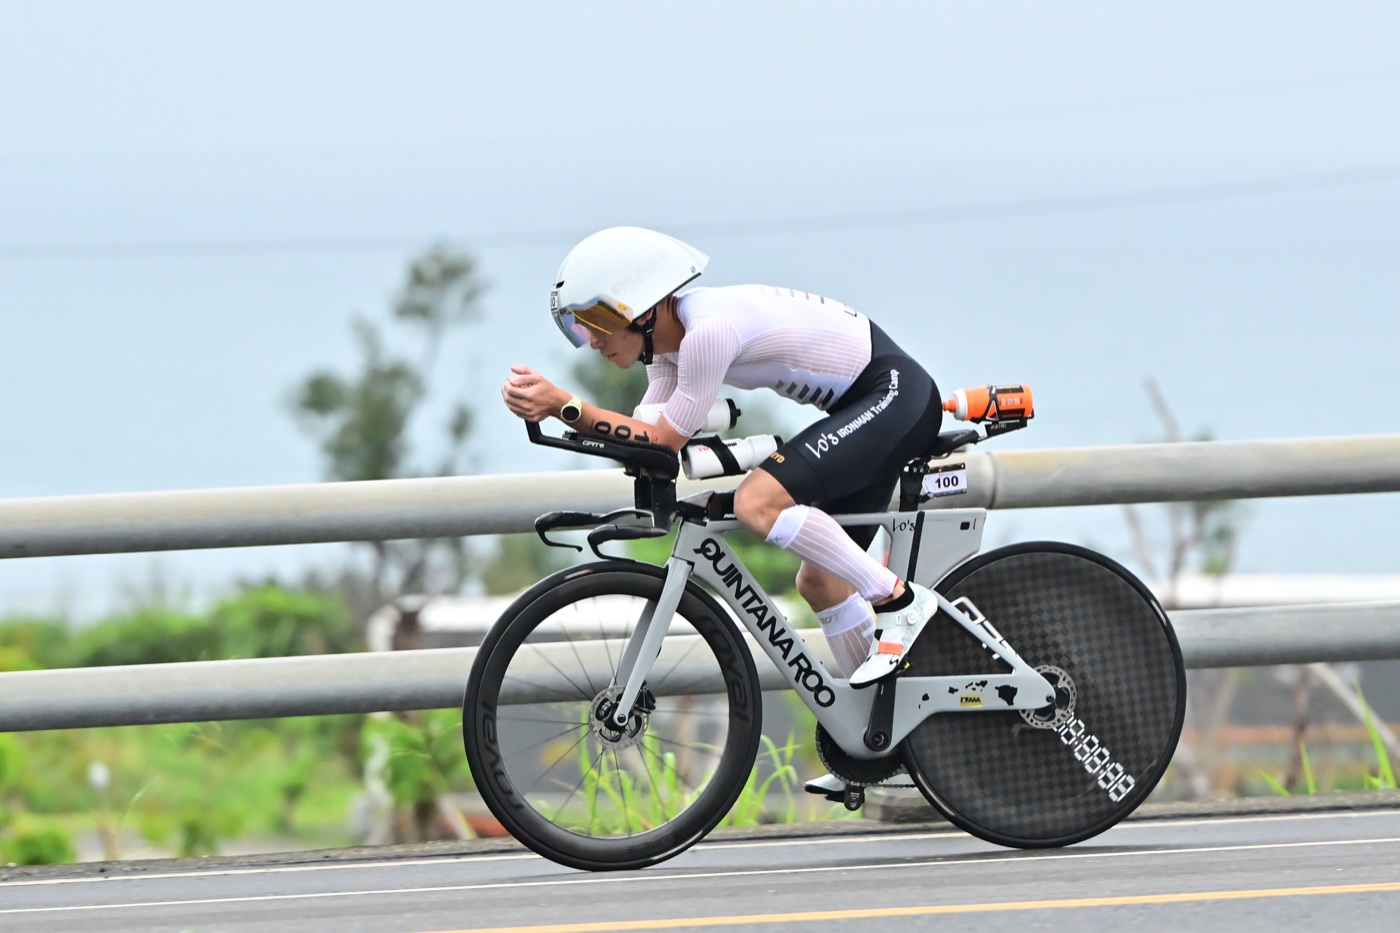
In April and May this year I uploaded five of my own training ride files to AeroPacer. The CdA came out as low as 0.218 and as high as 0.297. Same person, same Tri/TT bike, and the highest was 36% above the lowest. Over the same period I raced two full-distance (226) races, and the race files came out at 0.202 and 0.223, both lower than the 0.230 median of those five training ride files.
So when someone asks me what a good CdA is, I answer with a question first: what kind of file did the number you are comparing come from?
I covered what CdA is and how it is worked out from a power file in What is CdA?, so this article goes straight to the numbers.
What do the numbers on the site look like?
I pulled every CdA estimate out of the AeroPacer database (data as of October 19, 2026) and kept only the ones that passed the quality check. A file uploaded by two accounts counts only once. Virtual rides like Zwift have no real wind, so the system never accepts them in the first place, and they are not in here either. That left 71 files from 8 athletes, and 70 of those files were ridden on a Tri/TT bike.
These are de-identified aggregate statistics. Apart from my own files at the start, everything below reports only counts of athletes and files, medians and ranges. No individual athlete's own numbers are listed, and nothing here tells you who anyone is (how we do this is in the Privacy Policy).
| Tri/TT bike | Athletes | Files | Median | Middle half |
|---|---|---|---|---|
| Training ride files | 6 | 25 | 0.234 | 0.222 to 0.258 |
| Race files (all) | 6 | 45 | 0.224 | 0.211 to 0.246 |
| Race files (2025 onward) | 6 | 21 | 0.215 | 0.202 to 0.234 |
The median is the one standing right in the middle once you line up all the files from smallest to largest. The "middle half" is the range that is left after you remove the lowest quarter and the highest quarter.
If you ride a Tri/TT bike and your training ride files come out between 0.22 and 0.26, you are in the middle half of this group. Below 0.22 puts you near the front. Above 0.26, it is worth going back to check your position and equipment.
This group skews fast. Most of the 8 are athletes I coach, and I am one of them too; positions and equipment have been through several rounds of adjustment. With typical age-group athletes, the median would most likely be somewhat higher. And 8 people is too few: this table only works as a rough ruler, and it is not precise enough to rank anyone.
Why are race files lower?
Across all race files, the median is 0.010 lower than for training ride files. Look only at races from 2025 onward and the gap widens to 0.019. I can think of three reasons:
- Race-day equipment is different. A disc wheel, an aero helmet, a one-piece trisuit: in training you rarely use the full set.
- In a race, people are more willing to stay down in the aero position the whole time. On a training ride you often lift your head or sit up partway through.
- In a race there is always someone up ahead. Even if you keep the legal gap, the rider in front may already have pushed some of the air out of the way.
This data cannot tell how much each of the three accounts for. Just do not mix them up when you compare. Compare your training ride files with someone else's race files and you will think you are doing badly. Build a race plan on the CdA from your training ride files and the predicted time may come out on the slow side. On the CdA analysis page, every record can be tagged "Race" or "Training", and the list can filter them separately.
The same rider's CdA moves
Three athletes on the site have race files spanning several years, which happens to show how the same person changes over time. Take the median of each one's races before 2025 and from 2025 onward and compare: all three are about 0.03 lower from 2025 onward. Only the aggregate is reported here, not anyone's year-by-year numbers.
Under the same conditions as the engine table further down, dropping CdA from 0.25 to 0.22 makes a full distance (226) at 165 W about 12 min faster. What changed in between, the power files alone cannot tell you. It could be the bike, the helmet, the height of the aero bars, or simply getting better at staying low the more they ride. What is certain is that CdA keeps changing with equipment and position: a 0.26 this year does not mean 0.26 again next year.
A Tri/TT bike does not guarantee a low CdA
There are examples going the other way too. The site has a rider on a Tri/TT bike whose training ride files still come out higher than the 0.285 table value for "Road bike + clip-on aero bars".
The power files alone cannot say why. Maybe the rider sits too high overall, maybe the aero bars are stacked too high, or maybe the training rides were hardly ever ridden down on the bars. A power file only shows how much air that ride pushed aside. It cannot show what the rider looks like on the bike; for that you need photos or video of the ride. The type of bike only decides where you start from. Where your CdA finally lands depends on how you hold your position on the bike.
On a road bike, start with the table
There is only one road bike file on the site. One file does not make a distribution, and it should not be singled out either, so for road bikes all I can give you is the table values and the ranges widely cited internationally:
| Position | Files on the site | Table value (175 cm, 72 kg) | Typical range |
|---|---|---|---|
| Road bike (hoods) | 0 | 0.400 | 0.32 to 0.40 |
| Road bike (drops) | 0 | 0.320 | 0.28 to 0.36 |
| Road bike + clip-on aero bars | 1 | 0.285 | Between the drops and a Tri/TT bike |
| Tri/TT bike | 70 | 0.250 | 0.20 to 0.26; pros about 0.18 to 0.21 |
The typical ranges are numbers widely cited from wind tunnel and field testing, and different sources disagree by 0.02 to 0.04, so treat them as a direction only. The middle half of the 70 Tri/TT bike files on the site is 0.215 to 0.247, which sits right inside 0.20 to 0.26.
Adjust for body size first
CdA is an area: the bigger the rider, the more air they block from the front. When AeroPacer uses the lookup table, it scales by height and weight. 175 cm and 72 kg is the reference; a 160 cm, 55 kg rider is multiplied by 0.87, and a 185 cm, 85 kg rider by 1.09.
Say an athlete who is 185 cm and 85 kg comes out at 0.26 on a Tri/TT bike. Converted back to the reference size, that is about 0.24, which actually lands inside the middle half. Before you compare with anyone else, adjust for body size first.
How many minutes is 0.01 of CdA worth?
Here is what the engine says: a 68 kg athlete plus a 9 kg bike, flat road, no wind, 21°C, sea level, CdA dropping from 0.24 to 0.23.
| Distance | Average power | Bike leg time (CdA 0.24) | Saved by dropping 0.01 |
|---|---|---|---|
| 70.3 (90 km) | 160 W | 2:36 | 2.0 min |
| 70.3 (90 km) | 190 W | 2:26 | 1.9 min |
| 70.3 (90 km) | 220 W | 2:18 | 1.8 min |
| 226 (180 km) | 140 W | 5:28 | 4.3 min |
| 226 (180 km) | 165 W | 5:08 | 4.0 min |
| 226 (180 km) | 190 W | 4:52 | 3.9 min |
The slower you ride, the more minutes you save, not fewer. Over a full distance, someone riding 140 W saves 4.3 min, 0.4 min more than someone riding 190 W. A slower rider is out on the road longer, so a little saved every kilometer adds up to more.
The lower your CdA, the more time each 0.01 buys you as well. Same 70.3, same 190 W: going from 0.30 to 0.29 saves 1.7 min, and going from 0.21 to 0.20 saves 2.1 min, because 0.01 is a bigger share of 0.21 than of 0.30. It just gets harder to bring down the lower you go. A rider at 0.30 usually still has some position left to work on; by 0.21, there is not much left to change.
Now convert the earlier table. From the training ride file median of 0.234 to the median of race files from 2025 onward, 0.215, is a gap of 0.019. That is worth 3.8 min over a 70.3 (190 W) and 7.9 min over a full distance (165 W). Going from the 0.285 table value for road bike + clip-on aero bars to 0.25 on a Tri/TT bike makes a 70.3 6.2 min faster and a full distance 13 min faster.
Once you have your own number
- Compare with yourself first. Build up 3 or more files ridden on flat roads, in light wind, in the aero position the whole way, and look at the number in the middle, not at any single file. Upload them to CdA analysis and every record gets a quality rating; the ones that fall short do not count toward your converged value.
- When you compare with others, keep things separate: training ride files against training ride files, race files against race files, and adjust for body size first.
- If your Tri/TT bike training ride files come out above 0.26, check your position and equipment first. Below 0.20, suspect the data first: look for drafting, and check whether the head unit's elevation recording broke.
Back to the five files from the start, which ran from 0.218 to 0.297. If I picked just one to compare with other people, I could say I am near the front, or I could say I need to go fix my position, and either claim would have a number behind it. So I do not draw conclusions from the CdA of a single file. What matters is where it lands when you put it next to your own other files.