Articles /
How to calculate CdA without a wind tunnel: all you need is a power meter and an out-and-back road
Same flat road, same rider, same 200 W. On the way out, into a 2 m/s headwind, plugging average power and average speed into the formula gives a CdA of 0.371. On the way back, with the tailwind, it gives 0.172. This rider's real CdA is 0.25.
I simulated these numbers with the engine, but you will run into exactly the same thing on a real road. A wind tunnel measures drag directly, but not everyone can afford the cost and time of an hour in one. What most people do have is a power meter and a road they ride often. This article is about how to get a CdA you can trust from just those two things.
Why isn't the obvious calculation good enough?
On a flat road at a steady speed, the power you put out, minus drivetrain losses, gets used up by two things: pushing air aside, and friction between the tires and the road. Written as an equation:
Power × drivetrain efficiency = (½ × air density × CdA × speed² + rolling resistance coefficient × mass × g) × speed
Power, speed and mass are known, air density can be worked out from temperature and elevation, and rolling resistance can be roughly estimated from your tire model. That leaves CdA as the only unknown. The second calculator on the CdA calculator page does exactly this.
The problem lies in three assumptions: a flat road, a constant speed, and no wind. On a real road, a slight grade, a gust of wind or one touch of the brakes all get counted by the formula as part of the air resistance. Wind matters most, because air resistance depends on your speed relative to the air, while your head unit records your speed relative to the ground.
Most people's first reaction is: then ride it once each way and average the two numbers. Do that and the result still comes out 8% high. The reason is that on the headwind leg you ride slower and spend longer, and on the tailwind leg you ride faster and spend less time, so the two legs never carried the same weight in the total time. A straight average treats them as equal. Put the energy of the whole out-and-back into one calculation, and the error shrinks to under 1%.
Take this idea of calculating the whole ride together one step further, and you get the virtual elevation method.
What is the virtual elevation method?
The virtual elevation method (also called the Chung method) was proposed by Robert Chung in the early 2000s. It turns the question around: if I assume a CdA, what grade "should" the road have had at every second of this ride?
With power and speed for every second, subtract air resistance, rolling resistance and acceleration, and whatever power is left can only have gone into climbing. Power left over means you were going uphill; not enough means downhill. Add up the grade worked out for each second along the distance, and you get a "virtual" elevation profile.
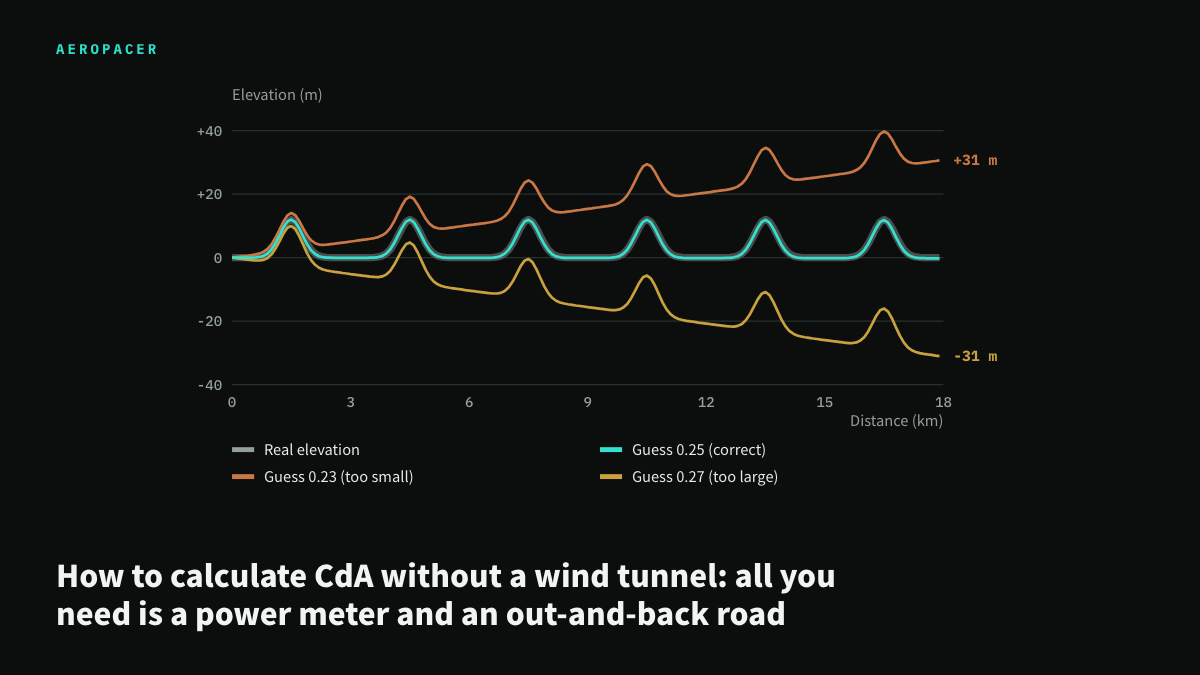
Here is the key: if you ride a loop, or the same stretch out and back, the real elevation at the start and the finish is the same. Guess the right CdA, and the virtual elevation comes back to the same height on every lap. Guess too small, and the calculated air resistance comes up short, so the extra power gets treated as climbing and the line ends up higher with every lap. Guess too large, and it ends up lower with every lap.
So what you need to do is simple: adjust CdA until the virtual elevation returns to where it started on every lap. That number is your CdA. Wind cancels out between the outbound and return legs, grade cancels out because every lap ends where it began, and acceleration is written straight into the equation. The Aerolab feature in the open-source software Golden Cheetah works on this principle, and you can drag a slider to line the curves up yourself.
How do you actually ride the test?
Once the method is right, data quality is what makes or breaks it. This is how I prepare:
- Find a road. A 1 to 3 km stretch with little traffic, no traffic lights and no need to brake, where you can ride a loop or turn around at each end. A few small rollers are fine, since virtual elevation handles grade anyway. What you cannot have is stopping.
- Pick your time. Early morning is usually the least windy. The wind does not have to be zero, but it cannot keep picking up and dying down: gusts stop the outbound and return legs from canceling out cleanly.
- Calibrate your power meter. Do a zero offset before you start. This is the step people forget most often, and I will explain below how much it matters.
- How to ride. Ride the same stretch 4 to 6 times, in the same position as on race day, and never draft. Keep your hands on the aero bars and only sit up at the turnarounds. Keep your power steady, but you can deliberately ride at two different speeds. The reason is also below.
- Recording. Set your head unit to record every second, and weigh the total once you are done: you, the bike, the bottles and everything you are wearing.
What can throw the number off?
Even if you ride it all correctly, three things can still bias the CdA you calculate, and you cannot tell which way it is off by looking at the result.
Getting rolling resistance wrong. The rolling resistance coefficient in the formula is a guess: about 0.004 for race tires on a good surface, about 0.005 for training tires. At 37 km/h, guess this coefficient wrong by 0.001 and CdA is off by 0.012, or about 5%. Ride at only one speed and you cannot separate the two: at a single speed, air resistance and rolling resistance look like the same line in the budget. Ride a few laps at each of two different speeds, and if your rolling resistance guess is wrong, the fast laps and the slow laps will give different CdA values. Adjust rolling resistance until the two sets agree, and only then are the two coefficients separated.
Power meter error. If your power meter reads 2% high, the CdA you calculate comes out 2.4% high. Power meters drift when the temperature changes a lot, so zeroing before you start, and zeroing again if the temperature shifts halfway through, does more good than any calculation trick.
A different position from race day. During a test you are fresh and focused, and you hold a lower position than you would late in a race. The number you get is your "best position", and whether you can hold it in a race is a separate question, which I covered in How do you dial in an aero position?
One test, or every ride?
Do one careful test with the method above and you will get a very good number, but it only represents that day, that equipment and that position. Change your helmet or adjust your aero bars, and you need to test again.
AeroPacer hands this job to your everyday riding instead. Once your head unit is linked, every outdoor ride with power automatically gets a CdA estimate from its flat, steady, non-drafting stretches, with the wind corrected using that day's hourly weather, and many rides are then combined. A single ride is not as good as a dedicated test, but after a dozen or so rides the number is steadier than any single test. Which rides get a number is covered in Your head unit is linked. Which rides actually get a CdA?
Back to the numbers at the top. 0.371 and 0.172 both came from the same rider, on the same day, at the same 200 W. The only difference is whether you accounted for the wind. The hard part of calculating CdA has always been the data. The formula itself is simple.
Further reading: What is CdA? covers why this number matters, and How much time does new gear save? covers how to use it to make decisions once you have it.